-
1. ManageArtworks
- Getting Started
- Super User
- Security and Permissions
- Dashboard
- Asset Library
- Reports
-
Workflow
- ManageArtworks Workflow
-
New Brand Design
- Project Initiation
- KLD/ED Inputs
- Design Brief Approval by Division
- Update Design Brief Details
- Design Brief Approval By Division (Updated Version)
- Design Brief Approval by Design Studio
- Concept Presentation By Designer
- Final Sign-Off
- Artwork Development & Proof Reading
- Artwork Approval by Division
- Artwork Approval By Reviewers
- QA Approval
- IDT Approval
- Artwork Release
- Purchase
- Soft Copy Validation
- Print Proof Signoff Design
- Product Code Linkage
- Modify Existing Artwork
- Activity Log
- Files
- Notification Emails
- Administration
- Viewer
- Workflow Actions
- User Creation
- Creation of New Position Code
-
2. Frequently Asked Questions (FAQ)
- Getting Started
- User Profile and Settings
- Dashboard
- Asset Library
- Reports
-
Workflow
- Project Initiation
- KLD/ED Inputs
- Design Brief Approval By Division
- Update Design Brief Details
- Design Brief Approval By Division (Updated version)
- Design Brief Approval By Design Studio
- Concept Presentation By Designer
- Update Concept Presentation by Designer
- Final Sign-Off
- Artwork Development and Proof Reading
- Artwork Approval By Division
- Artwork Approval By Reviewers
- QA Approval
- IDT Approval
- Purchase
- Soft Copy Validation
- Print Proof Signoff Design
- Administration
- Viewer
Clear History
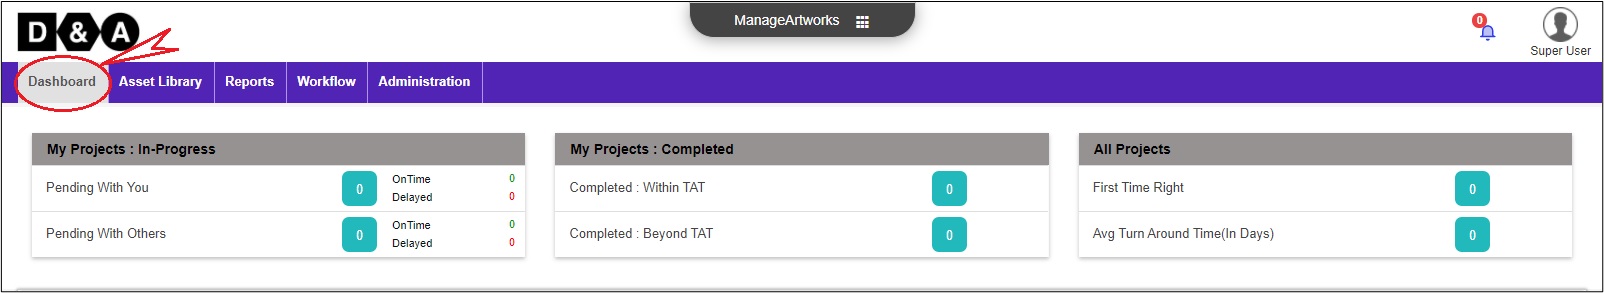
Dashboard
The welcome screen of the ManageArtworks application presents the user with a dashboard. The Dashboard has a set of tiles that provides real time data on the following:
- My Projects (In-Progress) – displays the count of projects pending action from this User.
- My Projects (Completed) – displays the count of projects where this user is a Stakeholder.
- All Projects – displays the count of total Projects handled by the application.
Note: Project Initiation and Artwork Approval metrics are segregated and shown by the system in the dashboard.
Under the categories described above, three data points are captured by the system:
- Total – displays the total count inside a blue tile which is the sum of on-time and delayed
- On Time – displays the count of activities/projects completed on time
- Delayed – displays the count of activities/projects that were delayed beyond stipulated time in the workflow
When a user clicks the tile containing the metric, corresponding items are populated in the section below.
Powered by ManageArtworks